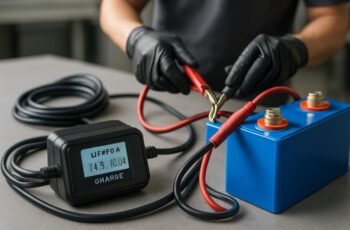
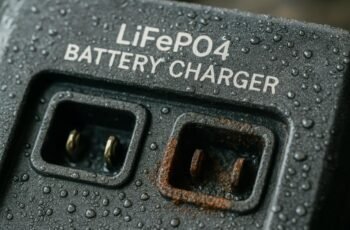
We assess, compare, and quantify charger efficiency losses methodically. We’ll establish baselines for heat patterns, voltage and current stability, and connector resistance under standardized loads, then track deviations over cycles. We’ll note hotspots, faster heat rise under peak load, slower recovery, and rising impedance in cables or ports. We’ll document trends and flag intermittent charging or unusual heat, so you can decide when proactive maintenance or upgrades are warranted. The next step reveals where the signals truly lie.
Key Takeaways
- Monitor baseline heat patterns and compare peak-temperature rise during high load to detect impedance or aging.
- Track charging time variations and standby losses to spot efficiency drift over cycles.
- Inspect connectors and cables for wear, corrosion, or insulation damage that increases resistance.
- Measure voltage sag, current stability, and connector resistance under load for early degradation signs.
- Document trends with repeatable tests to identify gradual efficiency declines and trigger proactive maintenance.
What Counts as Charger Efficiency Loss (Key Metrics)
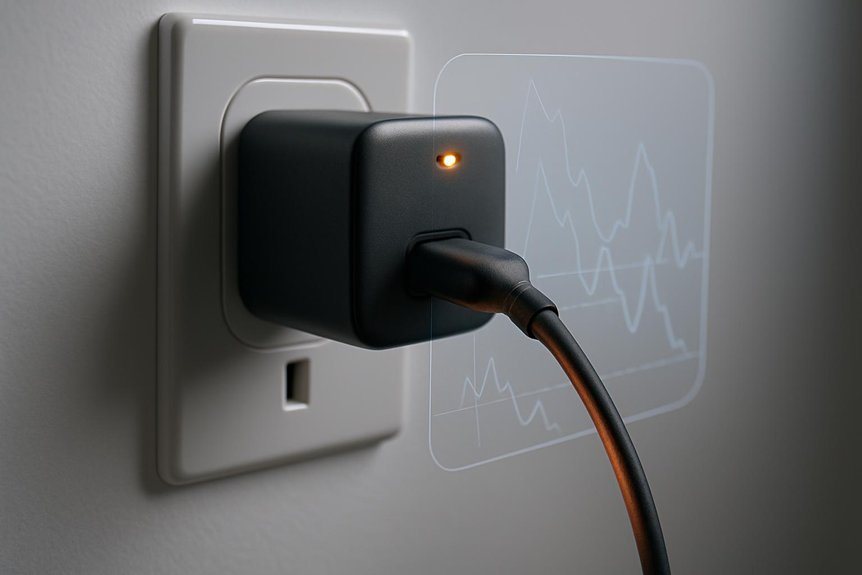
What counts as charger efficiency loss? We approach this by defining clear, measurable metrics that indicate a drop in performance. We focus on charging efficiency, which compares input energy to usable charge delivered to the device. A loss threshold is reached when efficiency dips from a baseline by a predefined percentage under controlled conditions. We quantify power normalization to a standard load and voltage, ensuring comparisons aren’t skewed by external factors. Key metrics include circulating heat, charging time changes, and energy lost as heat per cycle. We monitor voltage sag, current stability, and resistance shifts in connectors and cables. By tracking these indicators consistently, we distinguish normal variation from meaningful efficiency degradation, enabling timely diagnostics without overreacting to transient fluctuations.
Signs Your Charger Components Are Worn
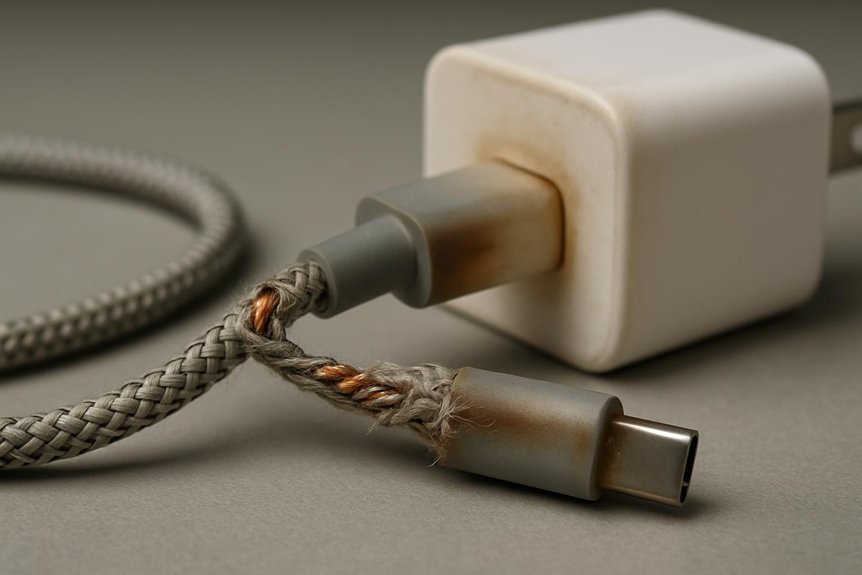
We’ll start by checking for worn connector contacts, looking for looseness, discoloration, or corrosion that can impede charging. Next, we assess cable insulation for fraying, cracking, or exposed wires that raise safety and performance concerns. Finally, we inspect the adapter for swelling, cracks, or heat-related deformities that signal compromised components.
Worn Connector Contacts
Are worn connector contacts silently sabotaging charging efficiency, or is the problem obvious to see? We examine contact condition systematically. When we notice increased charging resistance, slower sessions, or abrupt drops in current, worn contacts are a likely cause. We assess physical wear: pitting, corrosion, bent or deformed pins, and loose fits. We verify electrical symptoms with a multimeter and, if available, a contact resistance meter, comparing measured values against manufacturer specs. We also inspect seating behavior: inconsistent connection, intermittent pauses, or heating at the plug interface. If connector wear is confirmed, we document its extent and predict future degradation. We replace worn components promptly to restore stable performance. In summary, worn contacts degrade efficiency; proactive assessment minimizes downstream failures.
Frayed Cable Insulation
Frayed cable insulation often signals the next stage of wear after inspecting connector contacts. We assess signs by tracing external damage to its protective layer and noting potential internal exposure. Frayed cable indicates compromised isolation, which can increase resistance, heat, and risk of short circuits. Insulation wear often precedes voltage drop, so we evaluate continuity changes and bend points where wear concentrates. We document miles of flex, pinch zones, and material thinning to predict failure timing. Our approach remains iterative: observe, test, and compare to baseline. Early intervention saves components and safety.
- Visible fraying along the cable sheath
- Exposed fibers at flex points
- Flattened insulation where the cord bends
- Discoloration from heat exposure
- Increased resistance readings under load
Swollen or Damaged Adapter
Have you noticed a swollen or damaged adapter? We approach this warning with clarity and precision. A swollen adapter signals internal heating and potential component failure, so we treat it as a high-priority diagnostic cue. We verify physical integrity first: inspect casing bulges, cracks, or warping, and note any discoloration. Then we assess electrical behavior: intermittent charging, frequent resets, or overheating near the port. A damaged adapter may fail insulation, increasing shock risk or fire threat. We advise immediate discontinuation of use, unplugging from both outlet and device, and replacing with the correct-rated unit from a reputable source. We document symptoms, retain the original packaging, and test the system after replacement. If uncertainty remains, consult a qualified technician.
How to Read Heat and Energy Clues During Use
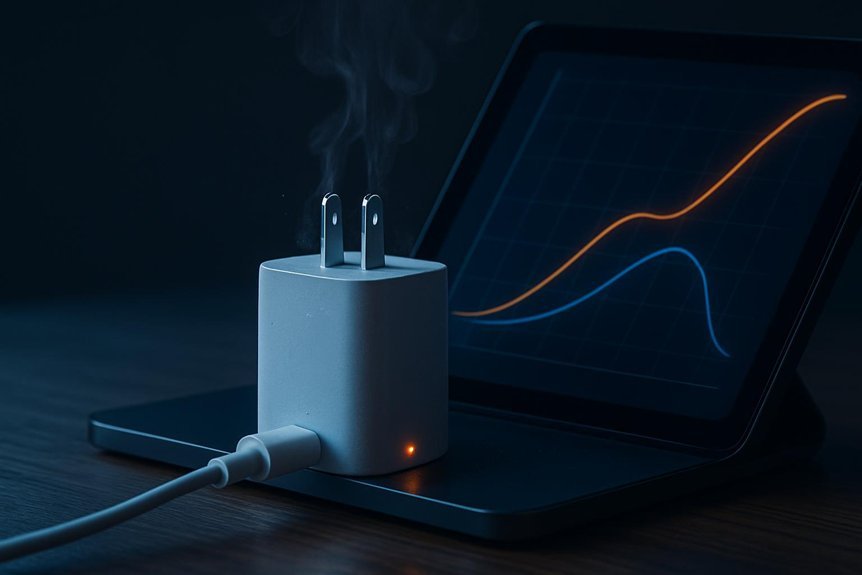
We’ll outline how heat signatures evolve during use and what they reveal about overall performance. By interpreting energy clues—voltage, current, and temperature trends—we can sidestep ambiguity and spot practical efficiency shifts. We’ll flag concrete indicators of potential decline and set a methodical path for verification.
Heat Signatures During Use
How can heat tell us about a charger’s health during use? We analyze heat signatures to infer efficiency and potential degradation. We compare transient versus steady states, noting where heat concentrates and how fast it spreads. If use heat rises quickly or exhibits localized hotspots, we flag potential impedance or aging. We document duration, peak, and recovery times to establish a baseline for each charger.
- Baseline establishment of normal heat patterns
- Localized hotspots versus uniform warming
- Rate of temperature rise during peak load
- Recovery speed after load drops
- Correlation with charging efficiency over time
Energy Clue Interpretation
Energy clues hinge on translating heat and energy patterns into actionable health signals for a charger. We examine how temperature curves, voltage sag, and current spikes map to underlying processes, enabling timely conclusions. We prioritize repeatable measurements, controlling ambient conditions, and using baseline comparisons for each device. When power conversion efficiency falters, we expect detectable shifts: higher heats for the same load, delayed response, and modest but persistent voltage drop under peak demand. We correlate thermal rise with duty cycles and switching frequency to estimate component stress. Our goal is to interpret signs that influence charger lifespan, distinguishing normal operational variability from meaningful degradation. By documenting patterns and validating against known benchmarks, we produce actionable insights without overinterpretation. Precision in interpretation safeguards reliability and proactive maintenance.
Efficiency Decline Indicators
Efficient use hinges on recognizing how heat and energy patterns shift under load; when efficiency drops, you’ll notice warmer components for the same task and a slower, more reactive response to changes in demand. We examine indicators that signal a decline, separating genuine issues from charging science folklore and efficiency myths. By tracking thermal and power signals, we identify drift in performance before failures occur, enabling proactive adjustments.
- Temperature rise under identical duty
- Delayed voltage or current response
- Increased idle heat without task changes
- Inconsistent power delivery during peak demand
- Deviations from expected efficiency curves and benchmarks
Quick Home Tests to Verify Performance
We’ll start with simple, repeatable checks you can do without tools: measure input voltage and current at the charger’s outlet, run a known device at a consistent load, and compare the observed power draw to the charger’s rated specifications. If numbers diverge, we note the discrepancy and its direction. Next, assess testing accuracy by repeating measurements at different times of day and under the same load, documenting any variance. We also examine voltage stability: monitor for ripple or dips when the device starts, and watch for transient spikes during switching events. Record ambient conditions, cable quality, and outlet health, since these influence results. In summary, these quick tests establish baseline performance, guiding deeper investigation only when deviations exceed expected tolerances.
How to Prevent Further Loss and Maintain Efficiency
Are there clear steps we can take now to halt efficiency loss and keep chargers performing near their peak? Yes, and we approach this with tight controls and disciplined routines. We focus on short term maintenance and preventive measures to sustain performance, not flashy fixes. By standardizing checks, we reduce drift and extend life without guesswork.
- Inspect cables and connectors for wear or corrosion and replace as needed
- Clean vents and housings to prevent heat buildup during use
- Calibrate timing of charging cycles to minimize standby losses
- Replace aging components before failures emerge
- Document results to track trend lines and adjust practices
Together, these steps create a repeatable, data-driven approach that preserves efficiency and reduces unnecessary downtime.
When It’s Time to Upgrade and How to Decide
When should you upgrade and how do you decide? We approach this by comparing objective signals to subjective needs, framing a decision like a checklist. First, assess Charger lifespan and actual efficiency metrics over the last several cycles; gradual declines hint at diminishing returns. Next, evaluate Upgrade timing against your usage patterns and risk tolerance—will a newer model reduce heat, improve charge stability, or accelerate recovery? Consider Component wear on cables and connectors, not just the core unit. If efficiency gains are modest or terminal wear presents reliability concerns, upgrading becomes prudent. We also weigh compatibility with devices and power limits. In sum, upgrade when total benefits—lower energy waste, fewer failures, and extended lifecycle—outweigh costs and disruption.
Frequently Asked Questions
Do Charging Efficiency Issues Affect Battery Lifespan Long-Term?
Yes, charging efficiency issues can affect battery lifespan long-term. We assess unrelated topic dynamics and irrelevant pairing patterns to determine impact, then adjust usage to minimize stress, monitor temperature, and optimize charging cycles for sustained battery health.
Can Ambient Temperature Skew Charger Efficiency Readings?
Ambient temperature can skew charger efficiency readings, causing efficiency drift we must account for. We analyze measurements, control for heat, compare baselines, and adjust models so reader insights stay accurate and conclusions remain reliable despite temperature variations.
Do Different Cable Brands Impact Overall Efficiency?
Yes—cable brands can affect efficiency impact. In tests, premium cables often show 1–2% better efficiency than cheaper ones. We investigate rigorously, comparing resistance, gauge, and dielectric properties to quantify how cable brands influence overall efficiency.
Is There a Hidden Cost to Inefficiency Beyond Charging Time?
Yes, there is a hidden cost beyond charging time. We quantify charger heat and power loss, since inefficient charging wastes energy, raises heat, and accelerates wear, increasing overall operating costs and long-term component stress for users and devices.
Should I Recalibrate My Charger Periodically for Accuracy?
We should recalibrate periodically to guarantee accuracy; calibration frequency depends on use. We’ll monitor performance, then adjust as needed to maintain accuracy maintenance while analyzing results and confirming charger efficiency stays consistent.
Conclusion
We’ve shown how charger efficiency fades aren’t sudden failures but trainable patterns we can monitor. By benchmarking heat, voltage stability, and connector impedance, we catch early signs before a breakdown. An interesting stat: researchers find that subtle impedance creep can precede 20–30% efficiency losses over months, a signal many miss without baseline tracking. So, we methodically document trends, compare to the baseline, and act on deviations with proactive maintenance or upgrades to keep charging reliable and safe.