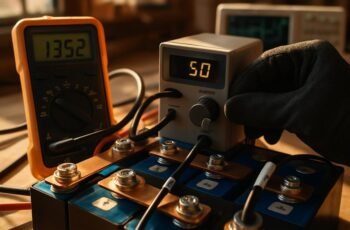
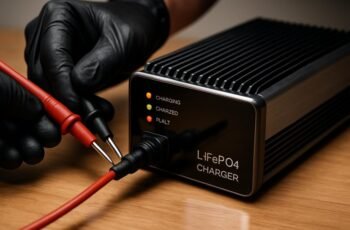
You might not know that LiFePO4 voltage behavior hides a lot of its aging story in the CC-CV transition. We’ll map the current targets, plateaus, and rise rates to pin down impedance changes and state of health. As we trace each phase, temperature and rest conditions anchor the data, guiding safe parameter choices. Stay with us as we connect curves to longevity and pack balance, and see how small shifts matter for reliability.
Key Takeaways
- LiFePO4 charging typically follows a CC-CV profile: constant-current charging to a voltage plateau, then a gentle constant-voltage taper to full charge.
- The CC phase shows rising voltage toward a plateau while current stays near the set rate, indicating impedance and cell health.
- The CV phase features decaying current as the cell nears full charge, with careful monitoring to avoid overvoltage or overheating.
- Voltage curves reveal health indicators: plateau position, slope sharpness, and transition timing reflect aging and capacity changes.
- Temperature, impedance, and balancing influence curves; monitoring delta V and delta T helps detect anomalies and guide safe charging.
LiFePO4 Charging: A Quick Start
Charging LiFePO4 packs is straightforward when you follow a disciplined, data-driven approach. We begin with a simple outline: identify appropriate charging profiles, monitor voltage curves, and verify temperature stays within safe limits. Our quick start emphasizes a conservative constant-current phase, followed by a gentle constant-voltage taper that stops as the cell reaches its target voltage. We keep current spikes to a minimum and avoid overcharging by ending well before the absolute maximum. Record baseline measurements for each pack and compare against manufacturer specs to reduce surprises. We document the observed voltage curves, noting plateau behavior and any deviations. With these steps, you gain reproducible results, enabling safer, faster, repeatable charging while preserving cell longevity and overall system reliability.
Reading CC-CV Phases and Plateaus
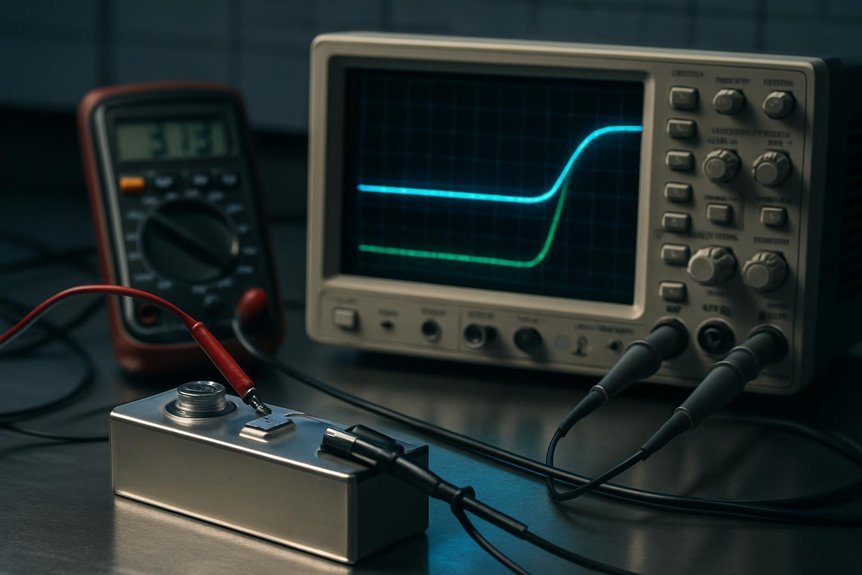
Have you ever noticed how the charging curve separates into distinct regions, and how those regions reveal the cell’s behavior? We examine CC-CV charging by identifying the constant-current (CC) phase, the transition, and the constant-voltage (CV) phase. In the CC phase, current remains near the set rate while voltage rises toward a plateau; we quantify how quickly voltage approaches the plateau to assess impedance and capacity. During the CV phase, current decays as the cell approaches full charge, and the plateau broadens if capacity is reduced or resistance increases. We watch for state transitions between regions to detect timing shifts, which may indicate calibration drift or aging. Accurate region delineation supports reliable predictions of remaining charge and end-of-charge criteria.
Using Voltage Curves to Assess Battery Health
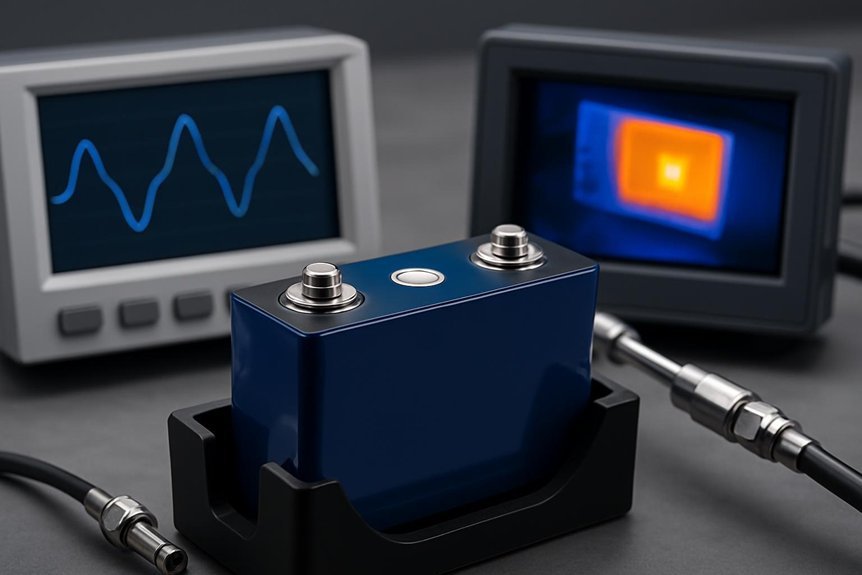
Voltage curves offer a direct window into battery health by tracking how the cell responds to charging and discharging current. We compare nominal resting voltage with actual dynamic response, focusing on the slope, plateau positions, and transition sharpness. Our approach uses consistent test currents and standardized state-of-charge references to ensure repeatable results. We perform voltage interpretation by mapping observed voltages to known LiFePO4 phase behavior, identifying deviations that signal health changes. We document curve irregularities such as unexpected inflections, abrupt slope changes, or delayed voltage recovery after load removal, and correlate them with charging efficiency and capacity retention. This method remains measurement-led, avoiding speculative conclusions, and provides a practical baseline for monitoring cells over time with clear, actionable indicators.
Temperature, Impedance, and Aging Effects
We examine how temperature affects impedance and how aging changes capacity, focusing on measurable trends and their causes. We will summarize the data: impedance rises with temperature shifts and aging, while capacity decay tracks usage and cycle history. Our goal is to connect these observed patterns to charging profiles and voltage curves for LiFePO4.
Temperature Impact On Impedance
Temperature has a clear, measurable impact on impedance, and understanding this helps diagnose aging and state of health. We examine how temperature drives material resistance changes, electrolyte conductivity, and interfacial kinetics. Our analysis uses controlled measurements across a defined LiFePO4 cell sample, with constant current pulses and calibrated thermometry. We observe that impedance generally decreases with moderate temperature rise due to faster charge transfer and ionic diffusion, then stabilizes as reactions reach new equilibria. Conversely, excessive temperature rise accelerates degradation pathways, increasing impedance variation over cycles. We quantify this behavior with Nyquist plots and time-domain impedance data, correlating peak impedance shifts to absolute temperature. This methodical approach supports temperature-aware remaining life assessments and informs thermal management strategies for consistent performance.
Aging Effects On Capacity
Aging effects on capacity unfold through a complex interplay of temperature, impedance, and degradation mechanisms, and we quantify them with systematic tests. We measure capacity fade under controlled temperature profiles, cycling frequency, and state-of-charge ranges to isolate drivers. We observe that elevated temperatures accelerate electrolyte decomposition and anode–cacifier reactions, while low temperatures limit kinetic accessibility, both contributing to reduced usable capacity. Impedance growth tracks aging, increasing charge transfer resistance and diffusive limitations, which depress available capacity during high-rate charging. We quantify capacity fade with reference cycles and differential capacity analyses, then correlate with impedance spectroscopy and half-cell studies. Readers should note that consistent aging effects emerge across scenarios, underscoring the need for optimized thermal management and conservative cycling to extend LiFePO4 cell life.
Practical Charging Guidelines for Multiple Packs
When charging multiple LiFePO4 packs, a disciplined, data-driven approach helps prevent imbalance and extend pack life. We present concrete steps that emphasize charge safety and pack integration while maintaining efficiency and accuracy.
1) Establish consistent charging currents per pack based on manufacturer specs and observed temperature behavior, then monitor delta V and cell temps for early anomaly detection.
2) Use synchronized timing and shared balancing routines, ensuring all packs reach their respective termination voltages within tolerance before disconnecting, minimizing cross-pack stress.
3) Log each session, tracking voltage, current, temperature, and state of charge, so trends guide future pack integration decisions and highlight fatigue or aging indicators.
This methodical practice keeps curves predictable, avoids over- or undercharging, and supports long-term reliability.
Detecting Risks and Optimizing Longevity With Profiles
We monitor charging profiles to detect anomalies early, using standardized thresholds and trend analysis to flag deviations before they escalate. We balance voltage across cells, correlate temperature data with charging stages, and quantify impact on cycle life to guide optimization. By linking profile features to longevity metrics, we translate data into actionable steps for safer, longer-lasting LiFePO4 packs.
Detecting Charging Anomalies Early
Have you ever noticed small deviations in charging curves that precede more serious issues? We’re here to show how we detect charging anomalies early, using data-driven checks that fit LiFePO4 behavior. By tracking voltage, current, and temperature trends, we flag patterns before they escalate. Our approach emphasizes reproducible thresholds and documented baselines, so early detection becomes a routine, not a guess.
- Monitor for gradual voltage slope shifts and time-based anomalies during constant-current and constant-voltage phases.
- Compare peak temperatures and delta temperatures against established profiles to identify anomalies.
- Log irregular current spikes or dips that deviate from expected charge-and-hold sequences and trigger alerts.
This disciplined method reduces risk, preserves longevity, and informs maintenance decisions.
Balancing Voltage, Temperature Effects
Balancing voltage and temperature is essential to extend LiFePO4 life, and our approach combines voltage profiling with thermal data to reveal risk regions and guide optimization. We analyze charging curves to identify when charging balance deviates from targets and when temperature effects shift cell impedance. By correlating high-rate segments with local temperature rises, we flag hotspots that threaten uniform aging. Our method uses synchronized sensors and timestamped readings to quantify delta voltage, delta temperature, and their duration across the pack. We convert these observations into actionable thresholds, enabling controlled adjustments to current or cell grouping. This disciplined, data-driven process prevents overvoltage stress and thermal runaway risk while preserving capacity. Readers gain a clear framework for monitoring, interpreting, and responding to balancing and thermal indicators.
Longevity Through Profile Optimization
Longevity hinges on optimizing charging and balancing profiles, not just reaching full charge. We examine how profile choices influence cycle life, degradation rates, and safety margins, using data-driven reasoning rather than anecdotes. Our approach merges textbook examples with real-world measurements to quantify trade-offs and identify risk factors that emerge during aging. We acknowledge controversial theories while validating or refuting them with controlled observations and statistical trends. By isolating charging rate, voltage ceilings, rest periods, and balancing cadence, we map failure modes to specific profile features and adjust accordingly. Our goal is to implement profiles that minimize impedance growth, preserve capacity, and maintain thermal stability over hundreds of cycles. With discipline, practitioners can design robust, repeatable, evidence-based charging strategies.
- Define acceptable voltage and current boundaries based on data.
- Schedule balancing to minimize stress and heat.
- Validate longevity gains through longitudinal measurements.
Frequently Asked Questions
How Does Lifepo4 Differ From Other Li-Ion Chemistries in Charging?
LiFePO4 differs by requiring lower charging voltage and flatter voltage curves, reducing risks; we prioritize longer life, stable cycles, and safer profiles. We monitor life cycle metrics and thermal management to ensure consistent performance and battery longevity.
Can Charging Profiles Affect Cycle Life Under High C-Rates?
Yes, charging profiles at high charging rates influence cycle life; we see accelerated degradation mechanisms and altered voltage curves, so we optimize balancing accuracy and charging rates to minimize wear despite demanding conditions.
What Role Does Cell Balancing Play in Lifepo4 Charging Accuracy?
Cell balancing improves charging accuracy by equalizing cell voltages, reducing measurement drift, and preventing over/undercharging. We systematically monitor each cell, adjust balancing currents, and verify pack-wide voltage一致 during charging, ensuring precise state-of-charge estimates and consistent performance.
How Do Partial-State-Of-Charge Cycles Impact Voltage Curves?
Thankfully, partial-state cycles shift voltage sag and distortion, altering curves. We quantify, test, and model how the partial state influences capacity readings, peak voltages, and slope changes, enabling precise SOC estimates despite fluctuating current demands.
Are There Safety Signs Not Reflected in Standard Voltage Curves?
We do see safety signs beyond standard voltage curves: sudden temperature rise, casing deformation, or odor indicate potential safety warning and thermal runaway risk, prompting immediate cessation and investigation with data-driven checks and protective measures.
Conclusion
We’ve walked through the charging map, turning curves into actionable signals. When CC hums at a steady rate and the CV plateau forms, think of the pack as a beacon, steady and honest. We monitor voltage rise, impedance shifts, and temperature whispers, logging each nuance like coordinates on a chart. With disciplined rest references and synchronized balancing, we steer clear of stress and overcharge. In precision, data guides longevity—we protect the pack with informed, deliberate charging.